The statistics box located in the bottom left corner of the page displays a quick snapshot of usage data for the selected meters. Average usage per unit per day is calculated based on the quantity of units entered on the Manage Account page.
The type of unit can also be changed on this page, for example:
- In schools, average usage per student per day
- In commercial/manufacturing, average usage per production unit per day
- In residential strata, average usage per bedroom per day
- In agriculture, average usage per head of cattle/sheep per day
- In councils, average usage per meter per day
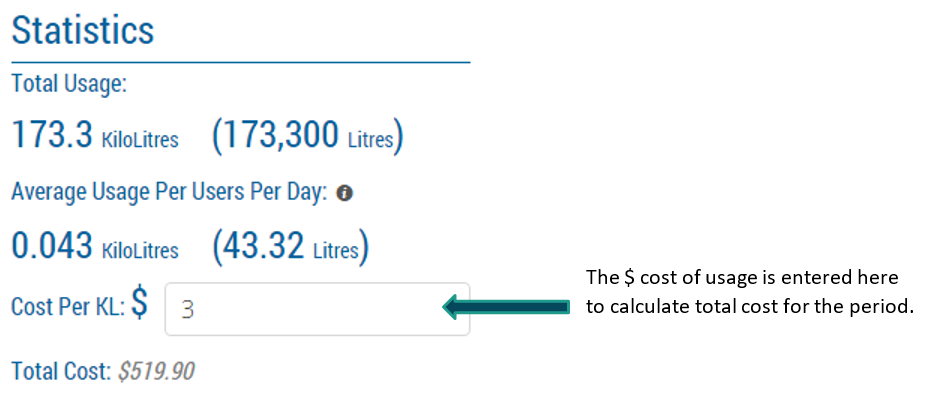
This is how the statistics box is displayed with average usage per users per day: