To display a meter on the graph, the user will select the bullet point next to the name of the meter. When the meter is selected it will change to a solid colour (green = active, grey= inactive).
This is an example of where selected meters have been highlighted for display:

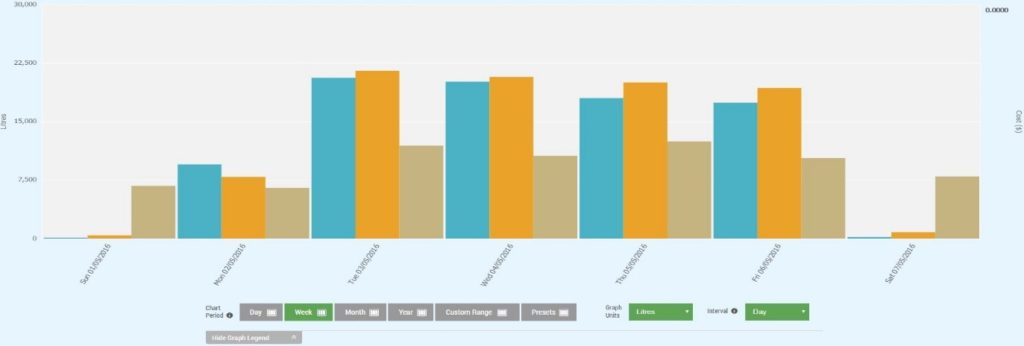
The selected meters will be represented on the chart with different colours, a legend below will indicate which colour each meter is.
![]()
